Data Visualisation Portfolio
Data Visualisation
Design
Visualisation Principles
ggplot2
📊 Data Visualisations
Explore my data visualisation portfolio, as I showcase ggplot2 skills in these diverse industries:
📈 Section 1: Finance Visuals
🍫 Vertical Bar Chart
🗻 Bump Chart
![]()
💹 Chart Combinations
💪 Section 2: Fitness Visuals
🏋️ HYROX Combination Plot
Click Image to enlarge 👇
This image was featured in the global data visualisation magazine Nightingale. You can read my featured article here
🏃 Running Combination Plot
Click Image to enlarge 👇
🏋🏻♂️ Circuit Training Plot
Click Image to enlarge 👇
RShiny App
👨💻 Code to generate your own HYROX, Cardio and Running Charts: https://github.com/andypetes94/fitnessPlotter
📈 Section 3: Football Visuals
⚽️ Shot Map
Click Image to enlarge 👇
️✚ Scatter Plot
Click Image to enlarge 👇
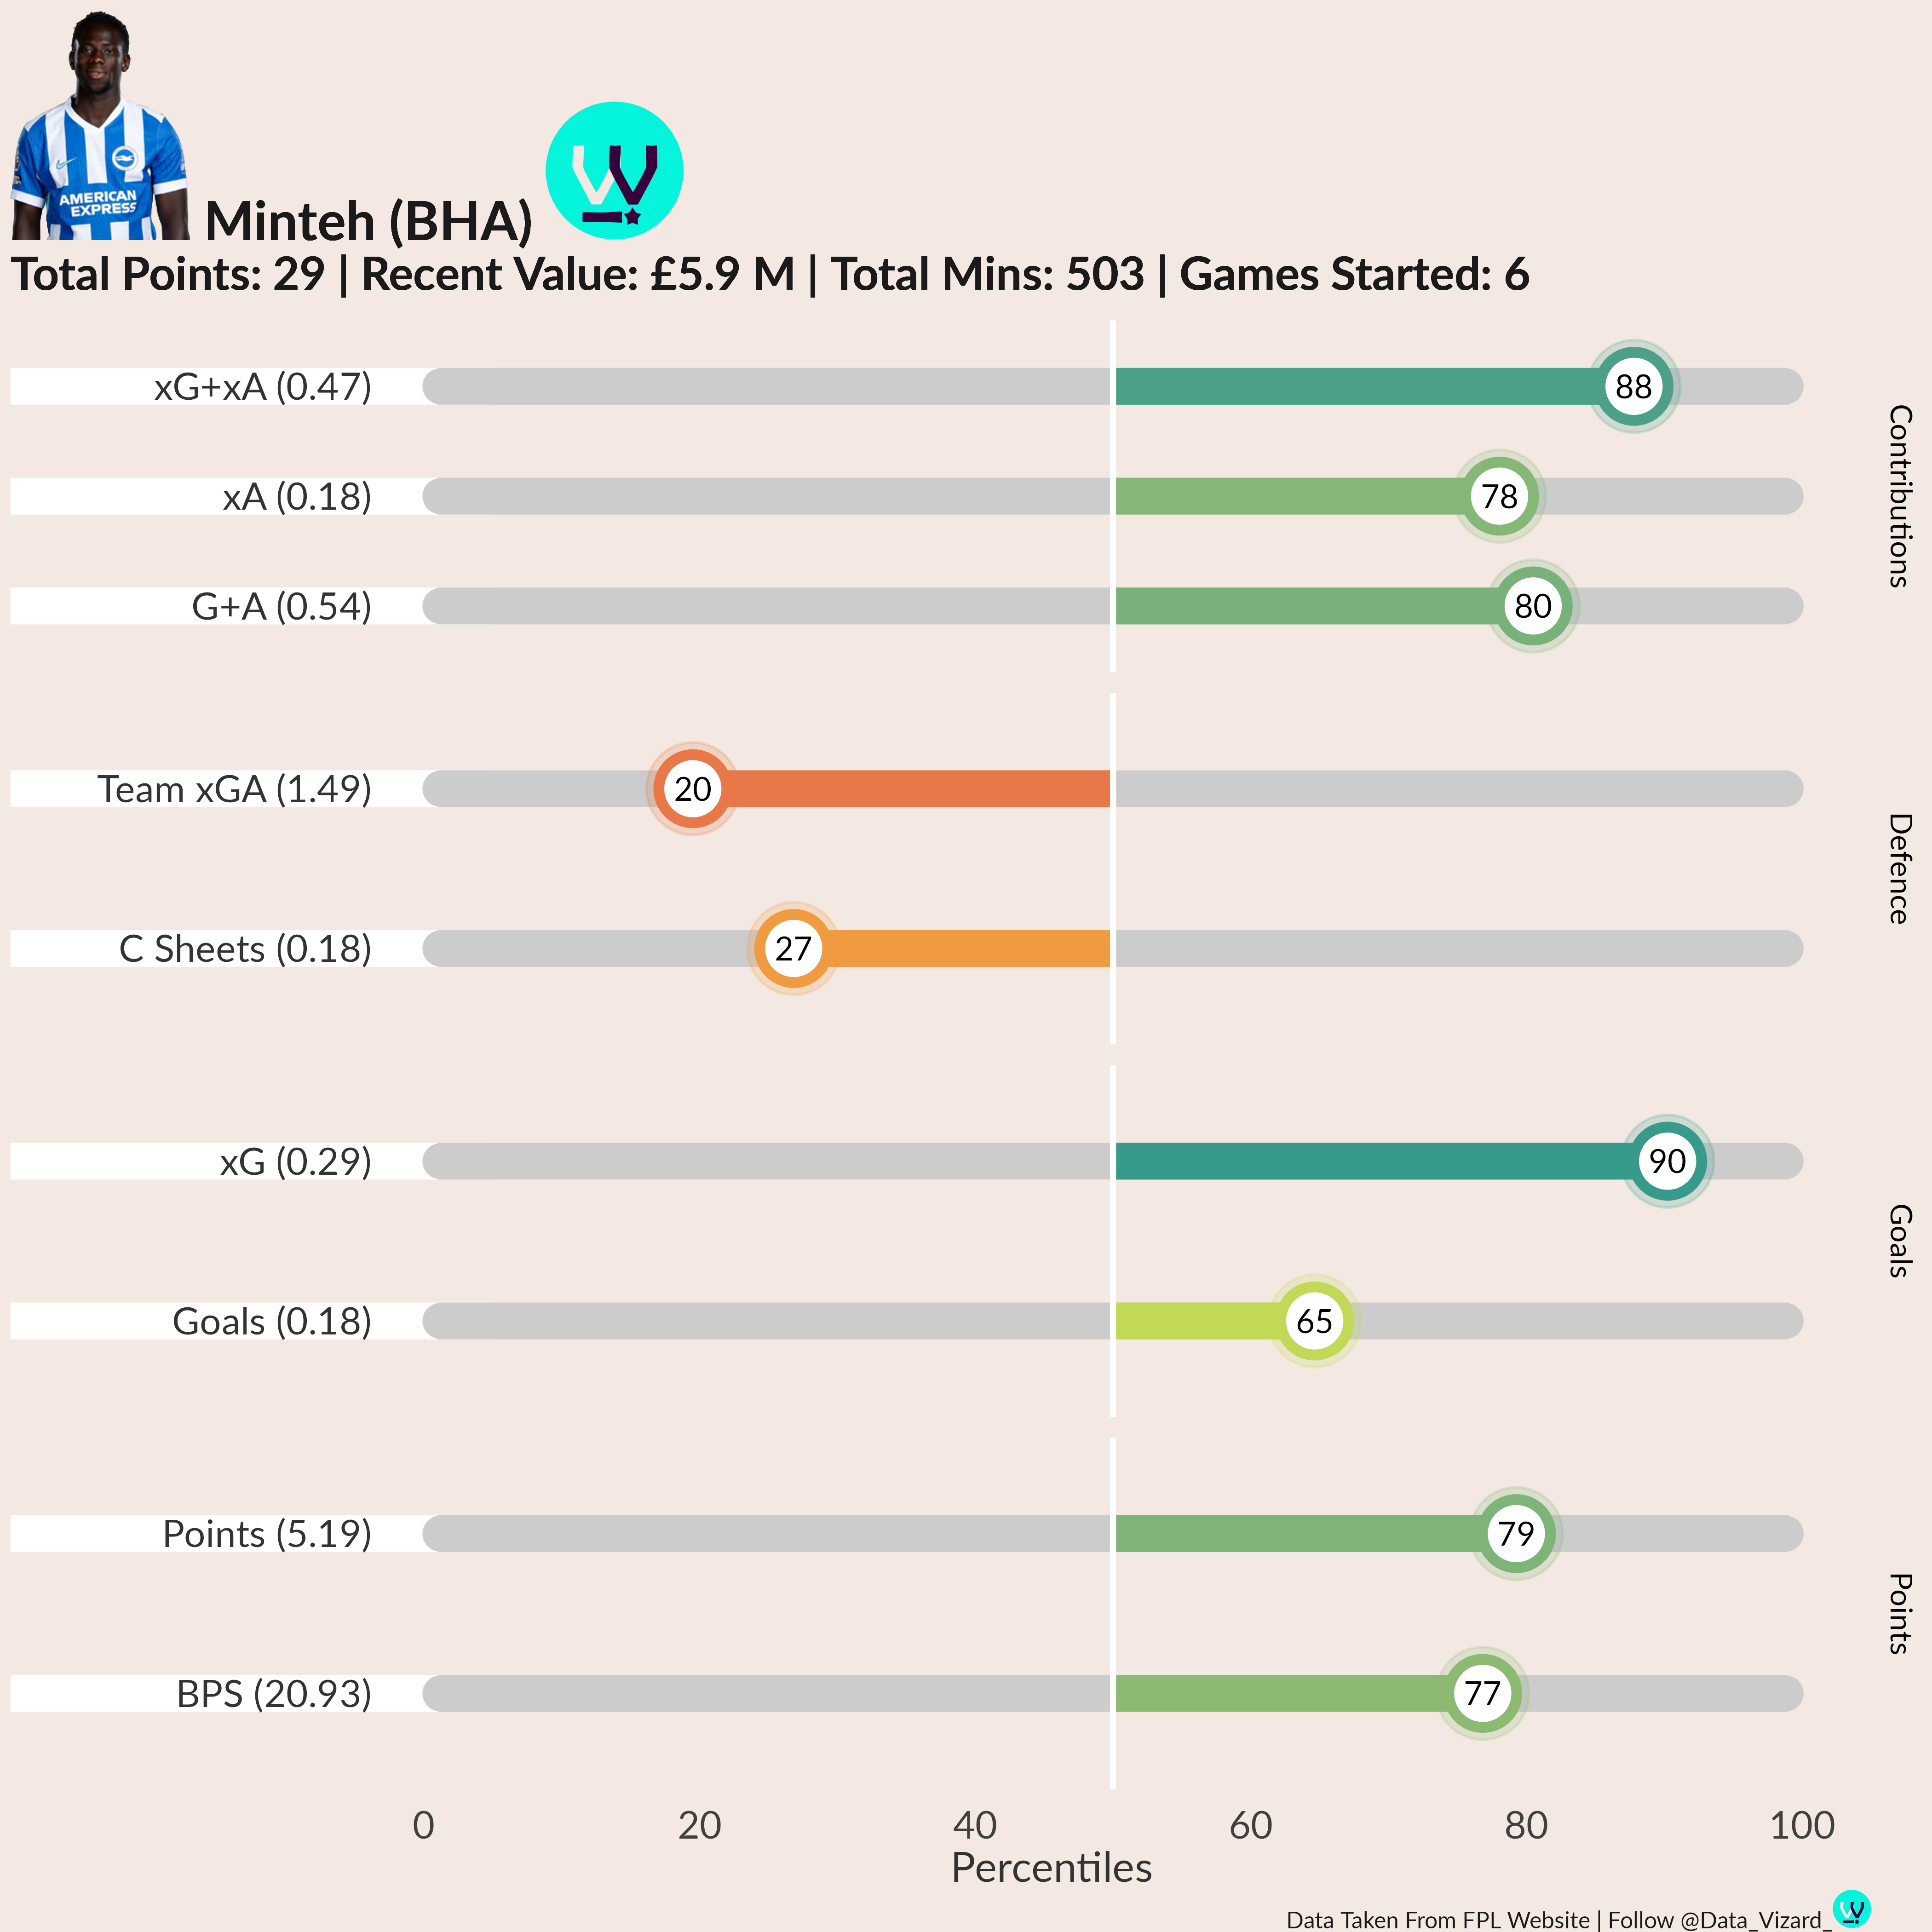
️% Percentile Plot
Click Image to enlarge 👇
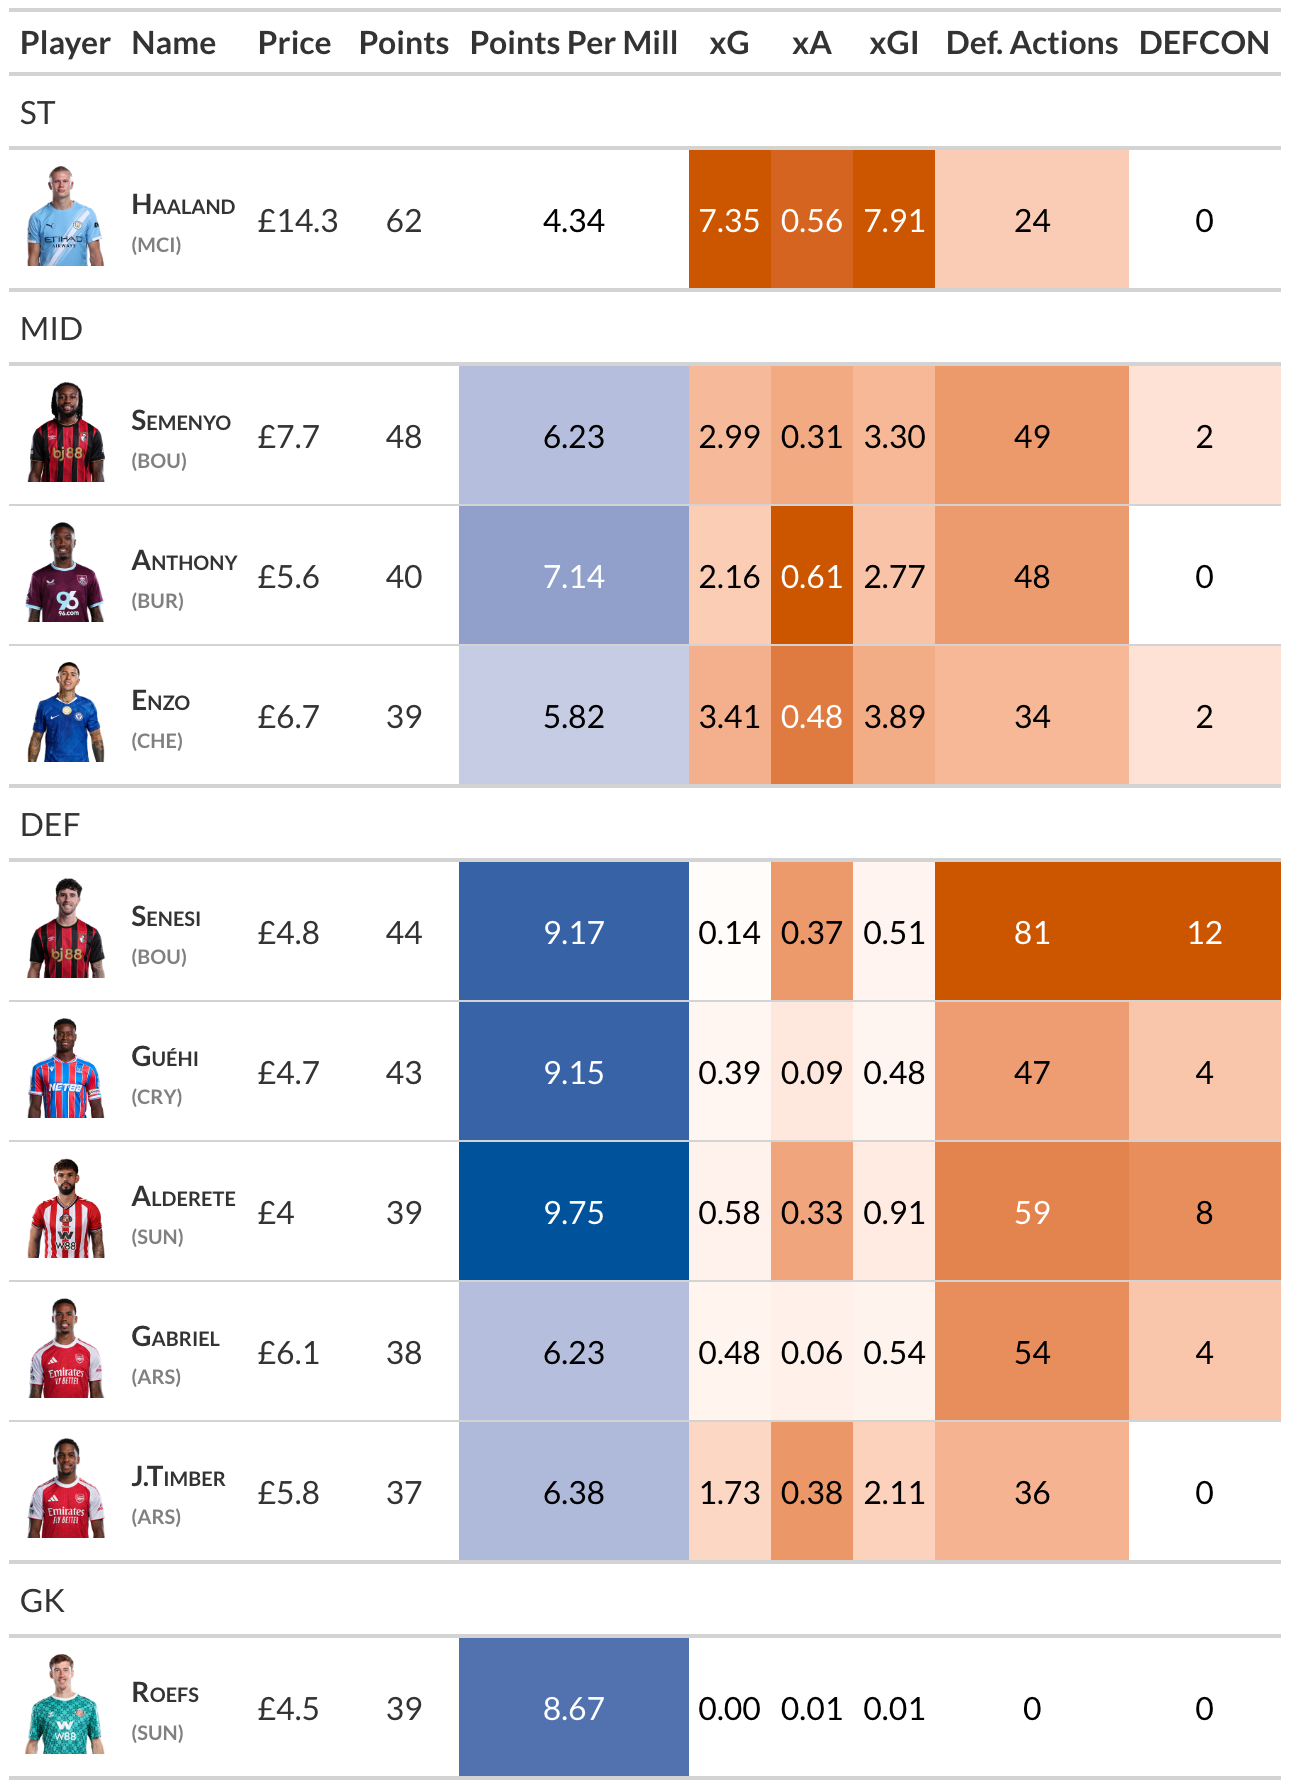
⌗ Data Tables
Click Image to enlarge 👇
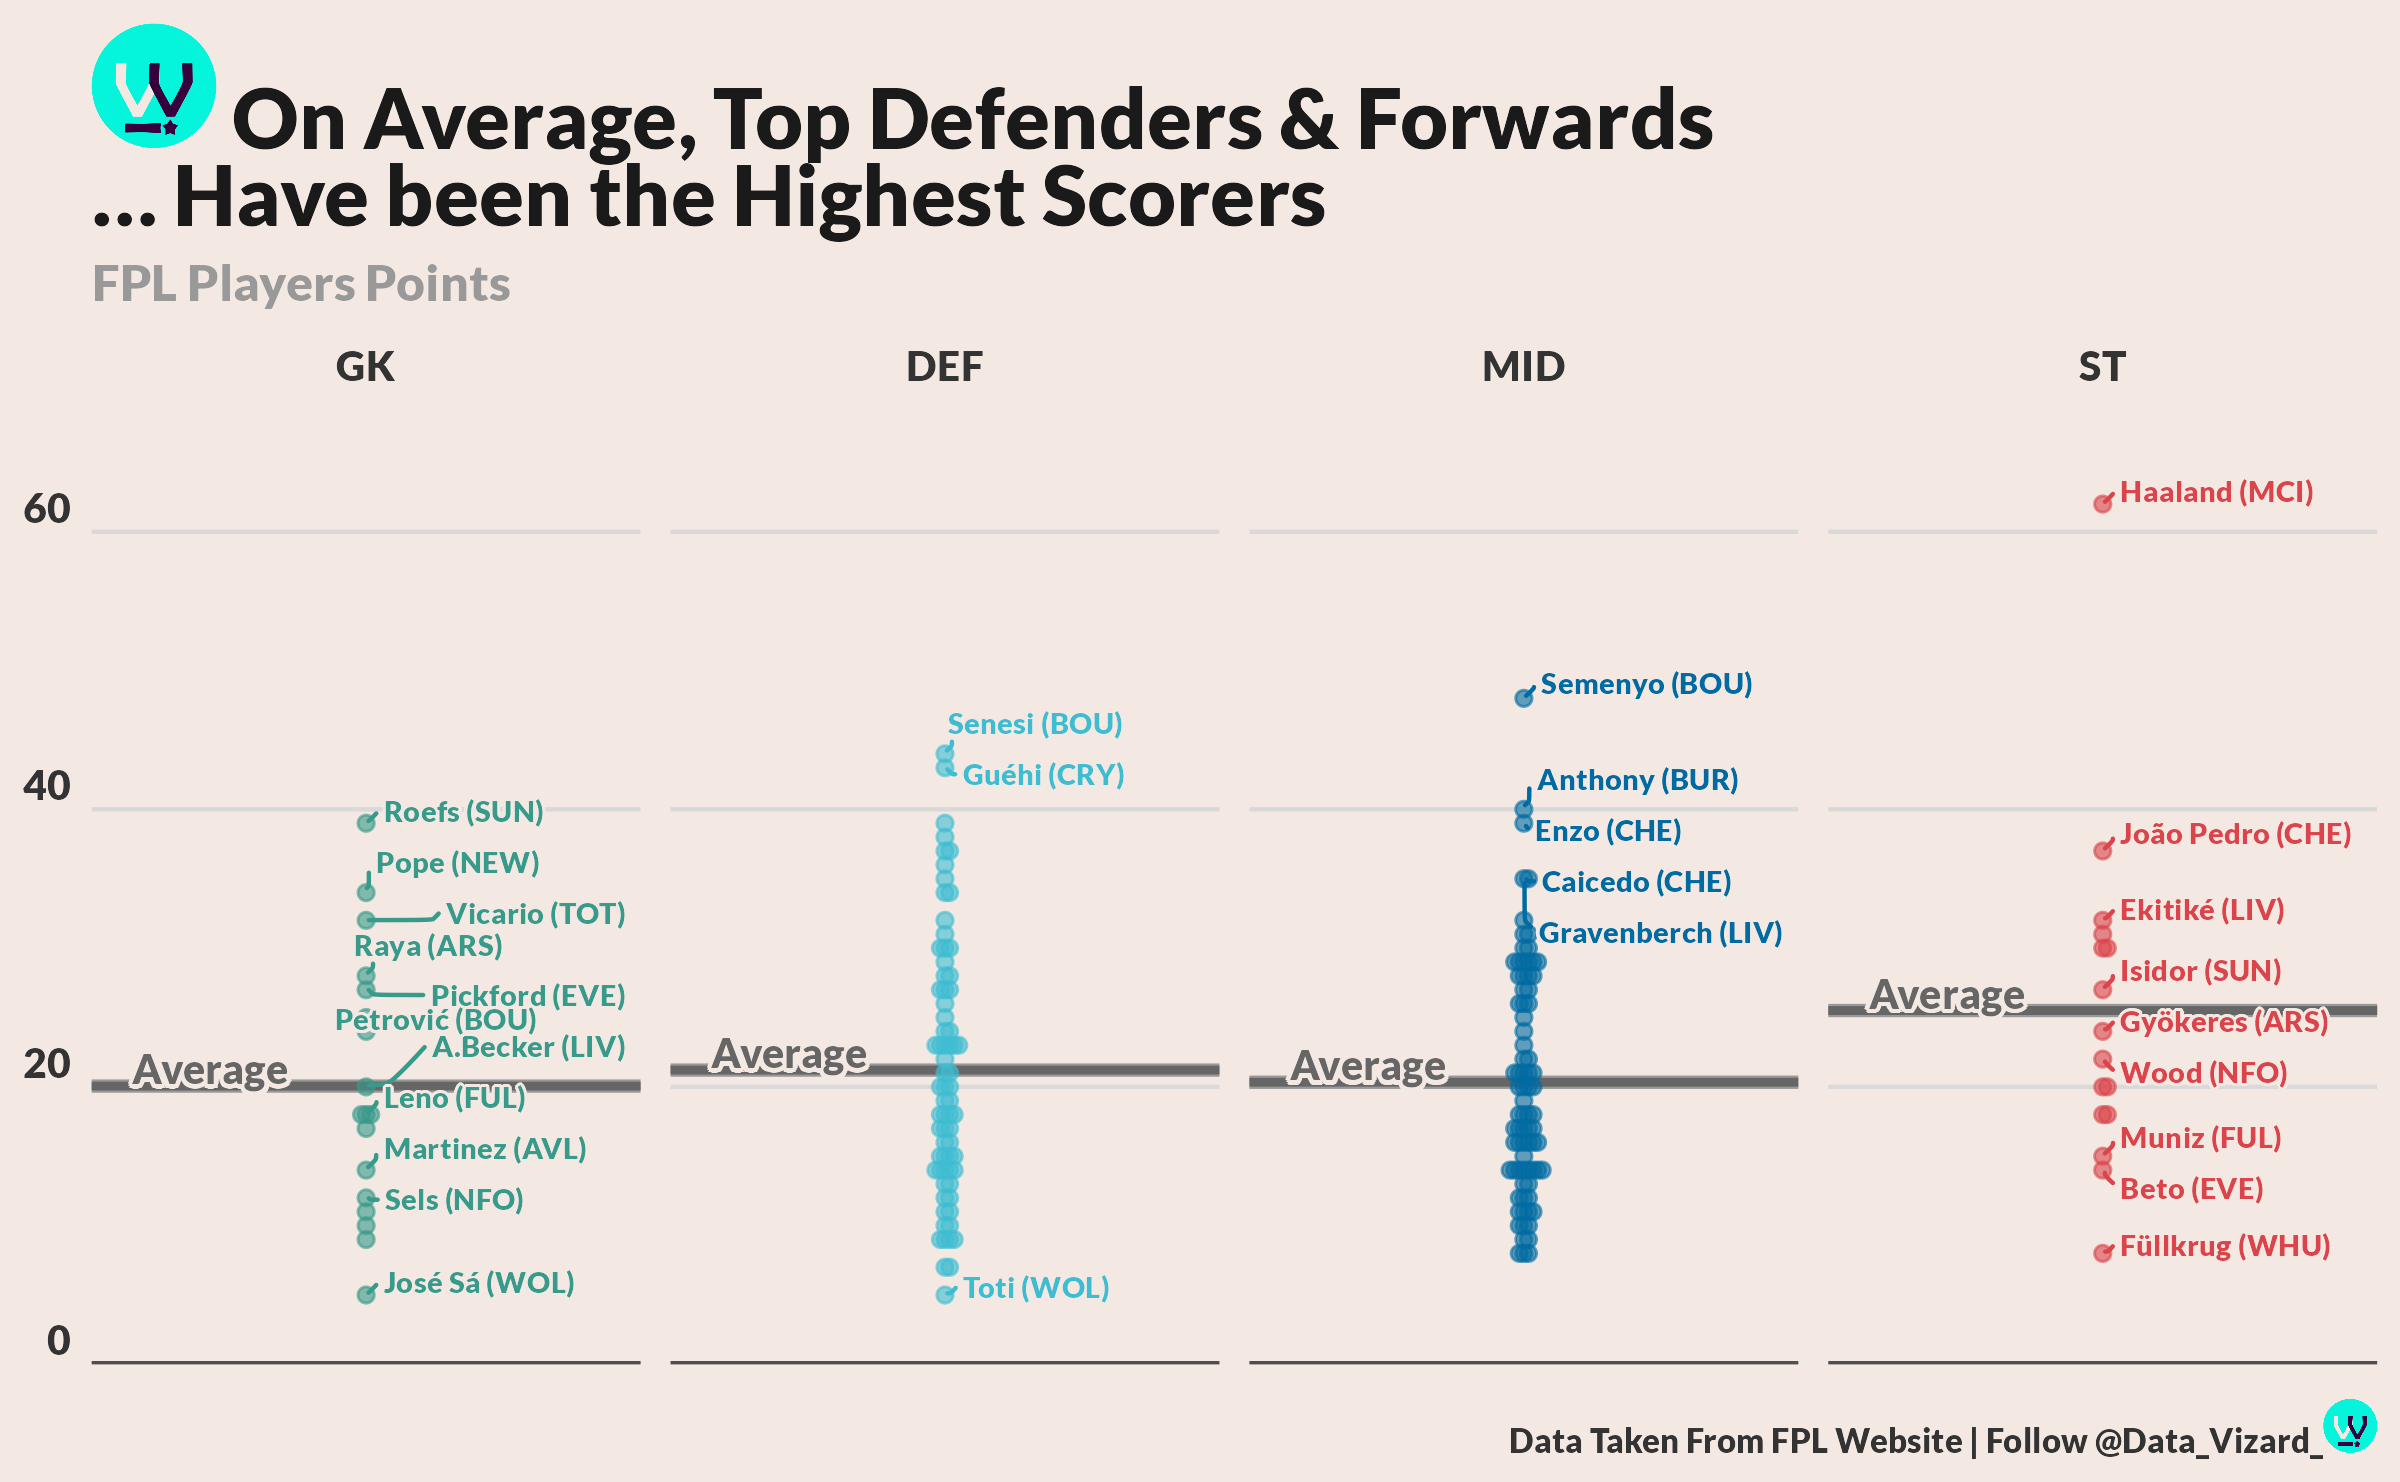
🥶 Jitter Chart
Click Image to enlarge 👇
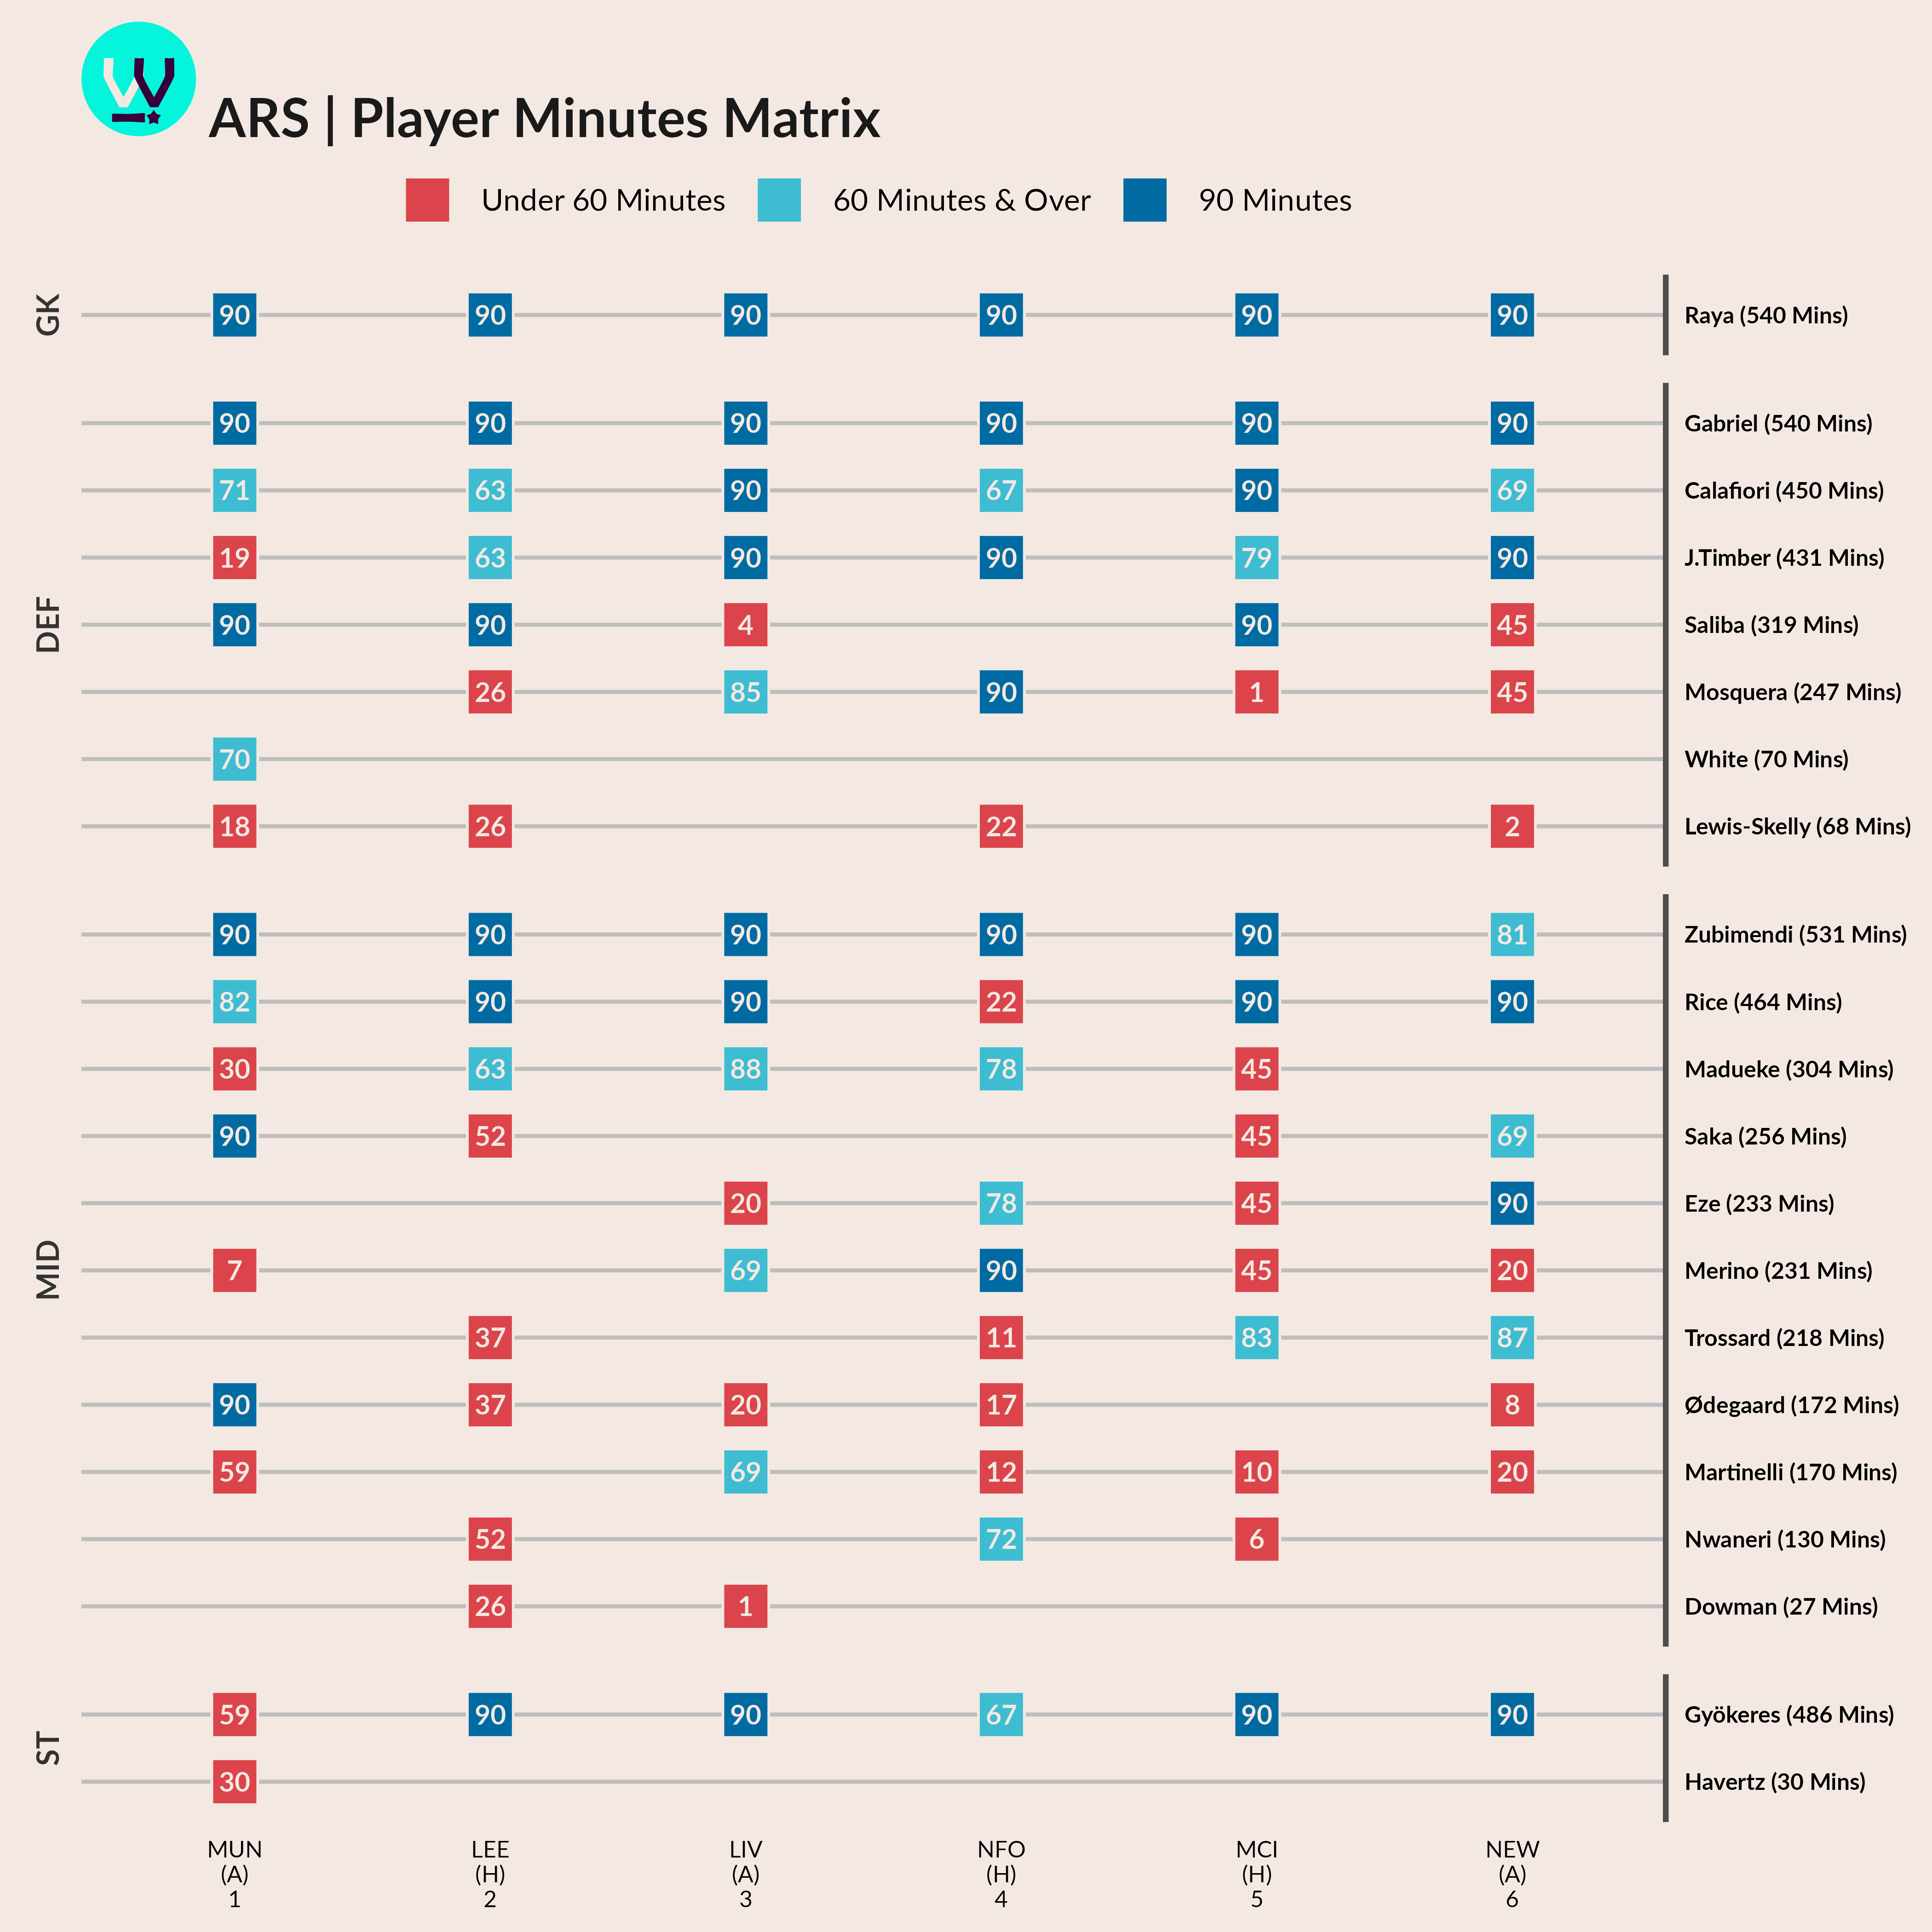
💻 Minutes Matrix
Click Image to enlarge 👇
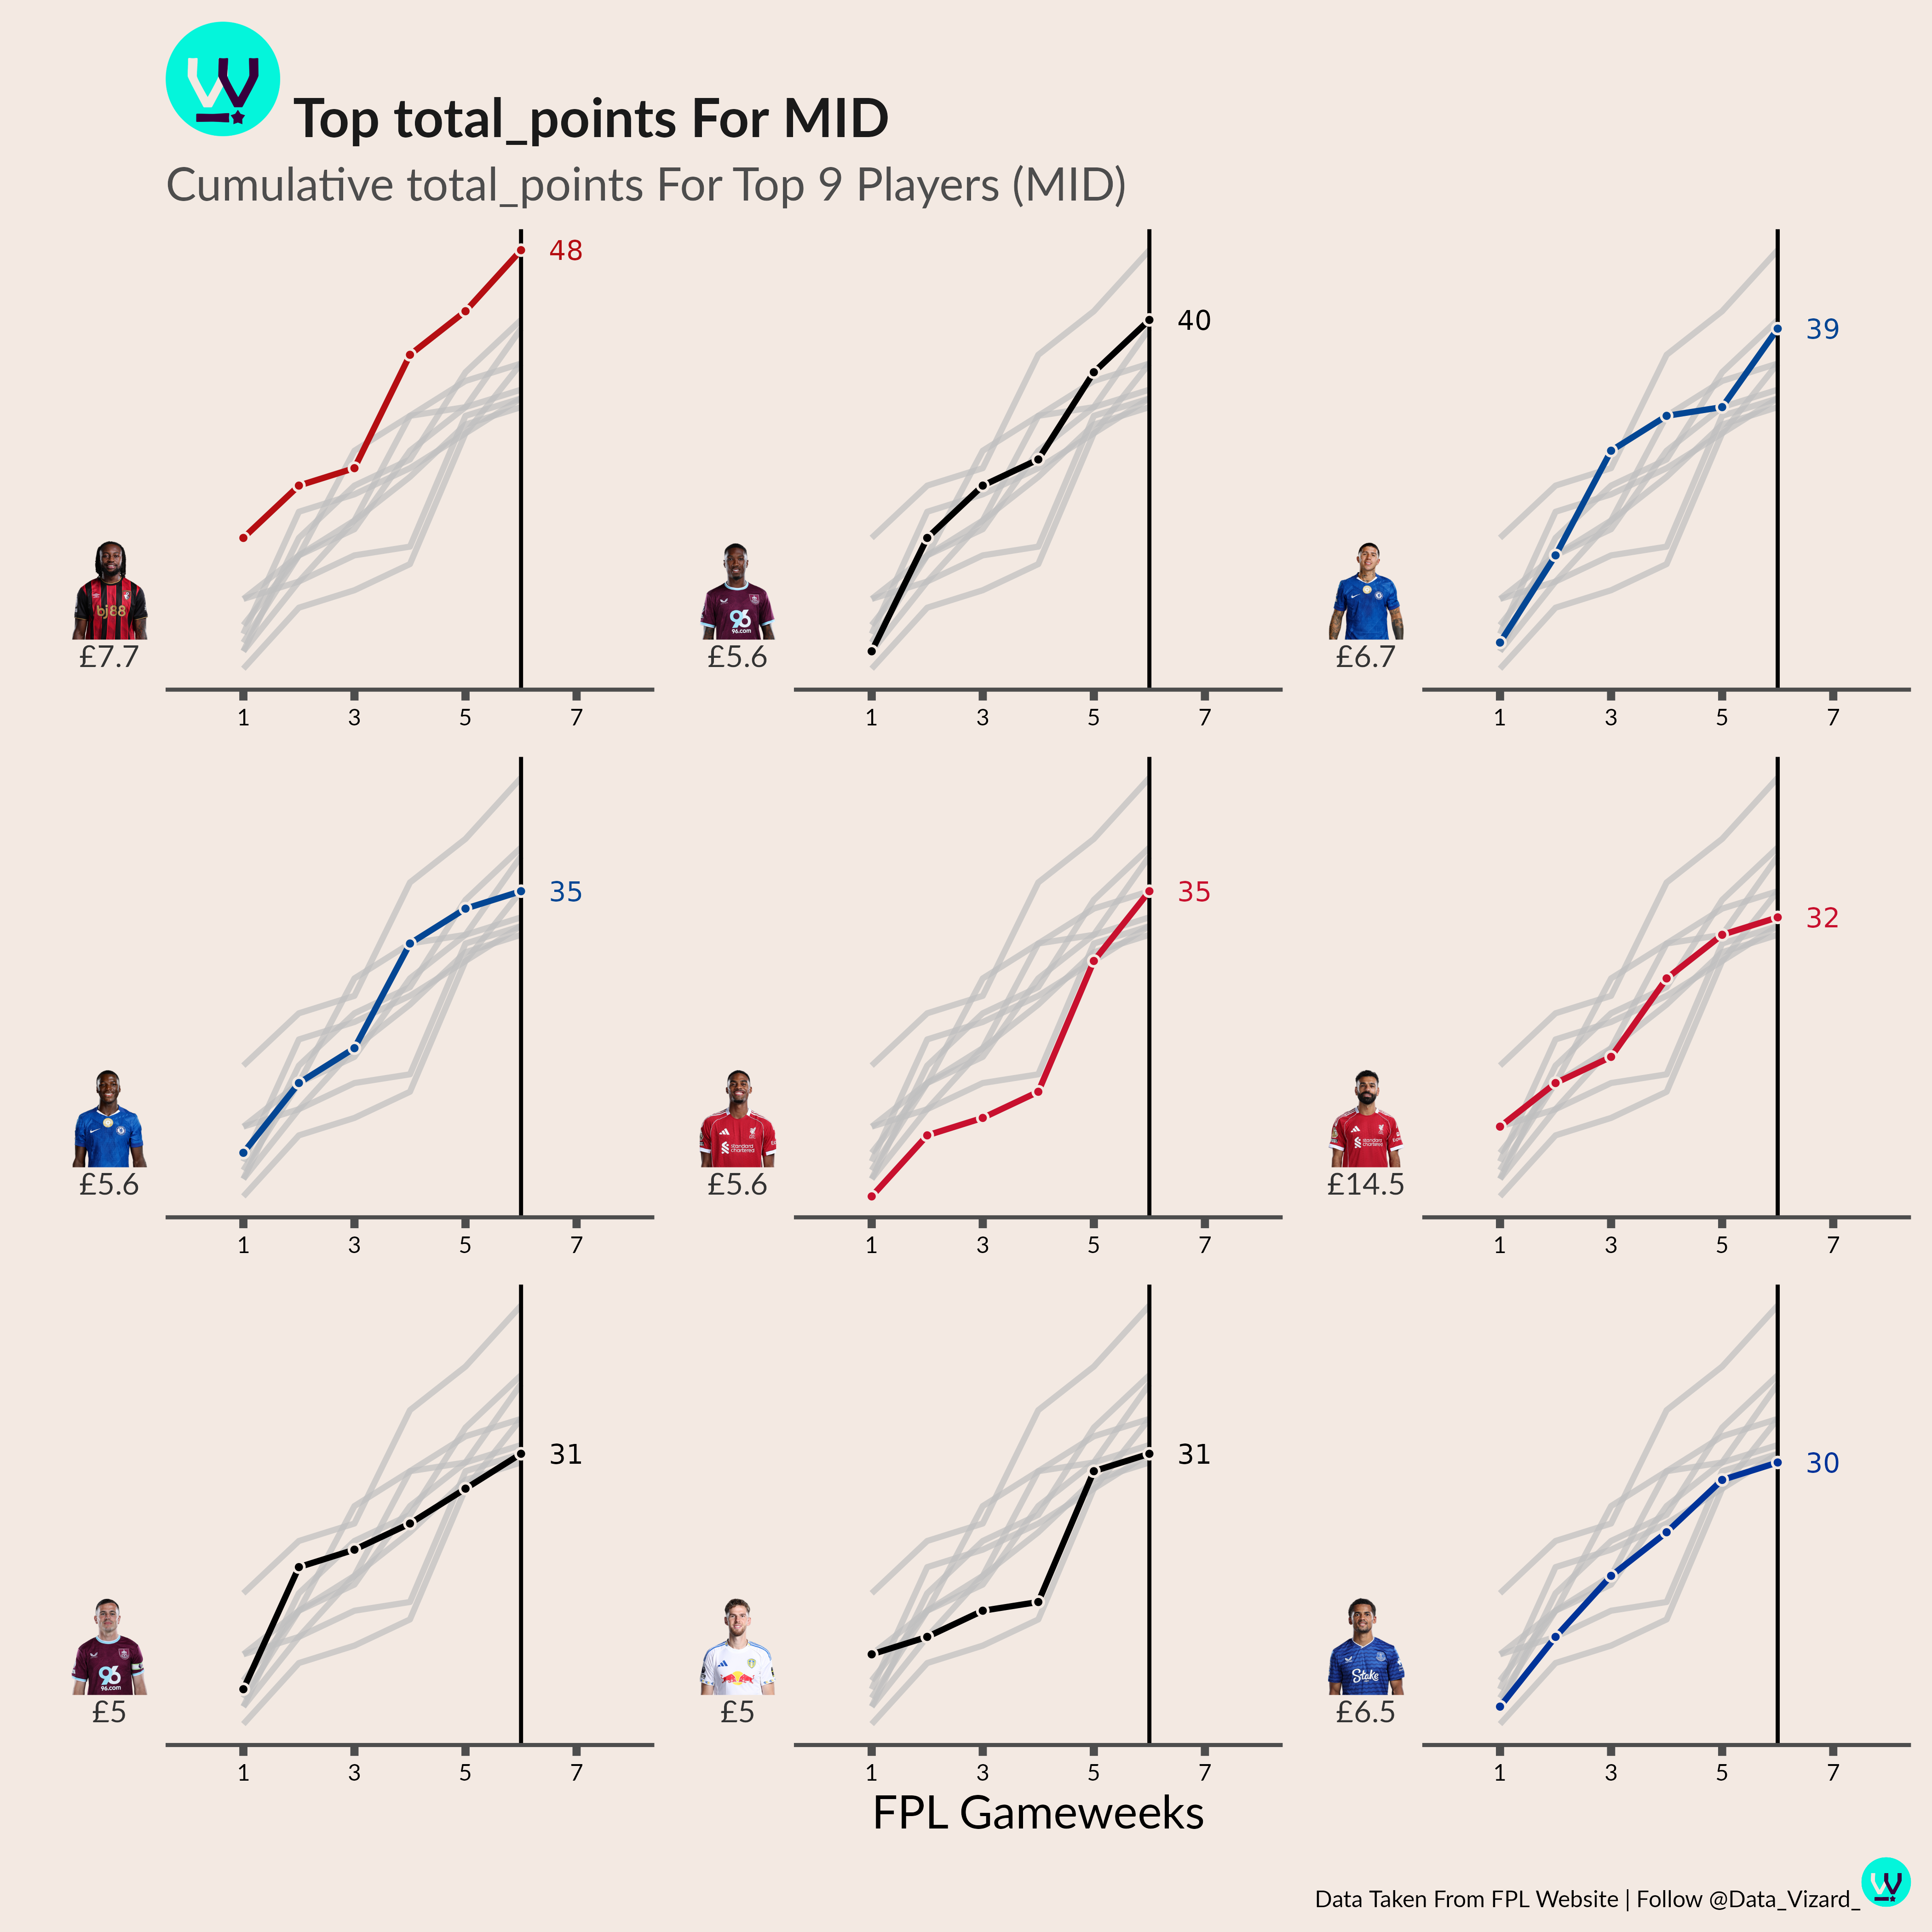
🔺 Cumulative Points
Click Image to enlarge 👇
📈 xG Trend Graph
Click Image to enlarge 👇